This post covers how to perform logging within AWS Lambda. Lambda has built-in integration to Cloudwatch logs, making it a default choice for logs, but the way a distributed system like lambda performs logging, is quite different from how you’d do in a monolithic app.
For the brave folks still reading this — let’s dive in.
Lambda Logging: 101
When building lambda functions, it’s always a good idea to sprinkle logging statements throughout your code — particularly in areas where something important happens. This is just generally good advice regardless of whether you’re using Lambda.
And Logs aren’t just for troubleshooting, they’re used for metrics, tracing, and information capture. In this post though, we’ll focus on using logs to give us visibility on specific Lambda invocations to triage issues.
Unfortunately, log statements by themselves are useless, in order for them to be valuable, they need to appear somewhere accessible. You can have the most generous log statements known to mankind — but it still won’t help you, if those logs are locked up in an inaccessible container.
Lambda has no SSH capability, so you can’t just log out to files — because those files will be inaccessible. But it does have in-built cloudwatch logs integration, which makes shipping logs to Cloudwatch far easier compared to EC2 or Fargate. It literally is 2 lines of code in Python to setup.
Better still Cloudwatch Logs requires no configuration to setup, can be viewed directly from AWS console, and is a purely serverless offering. For more detailed analysis, you can ship them off to your 3rd-party tools, like your own ELK stack, but today we’ll explore just how far we go with native tools in AWS like Cloudwatch Logs and Cloudwatch Insights.
Note: Cloudwatch Logs is a service that is distinct from Cloudwatch. Do not confuse the two to be same thing — it isn’t even referenced with the same service name in boto3 (logs vs. cloudwatch)
Log Hierarchy
If you’ve ever used Cloudwatch you’d notice these things named LogGroups and LogStreams, and initially they can seem confusing.
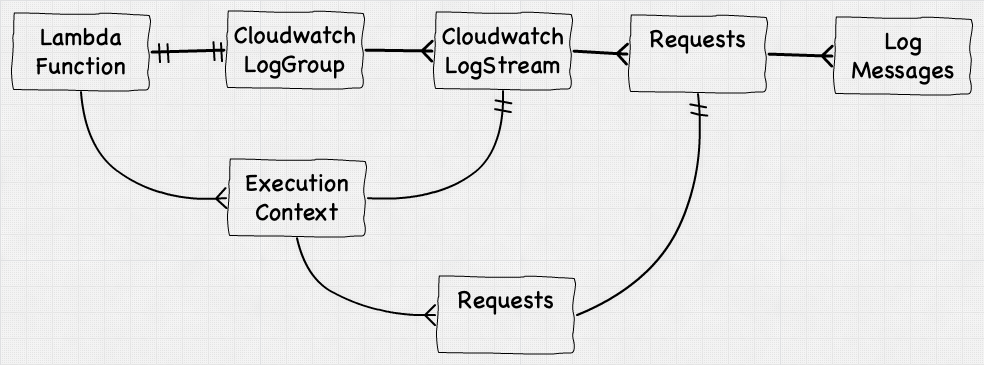
A LogGroup is a single ‘partition’ within Cloudwatch that captures data, and LogStream is a sub-partition within that group that actually stores the individual log messages. Within frameworks like Serverless Framework, the default behavior is to create a LogGroup per Lambda function.
Each LogGroup will then have multiple LogStreams — with each LogStream corresponding to one Execution Context, the more parallel executions you spin up, the more Execution Contexts get created, and the more LogStreams you have in that LogGroup.
LogStreams, like the name implies, are streams of log messages, arranged in chronological order, with a clear delineation between each request. The overall relationships looks like this:
And on the console it looks like this:
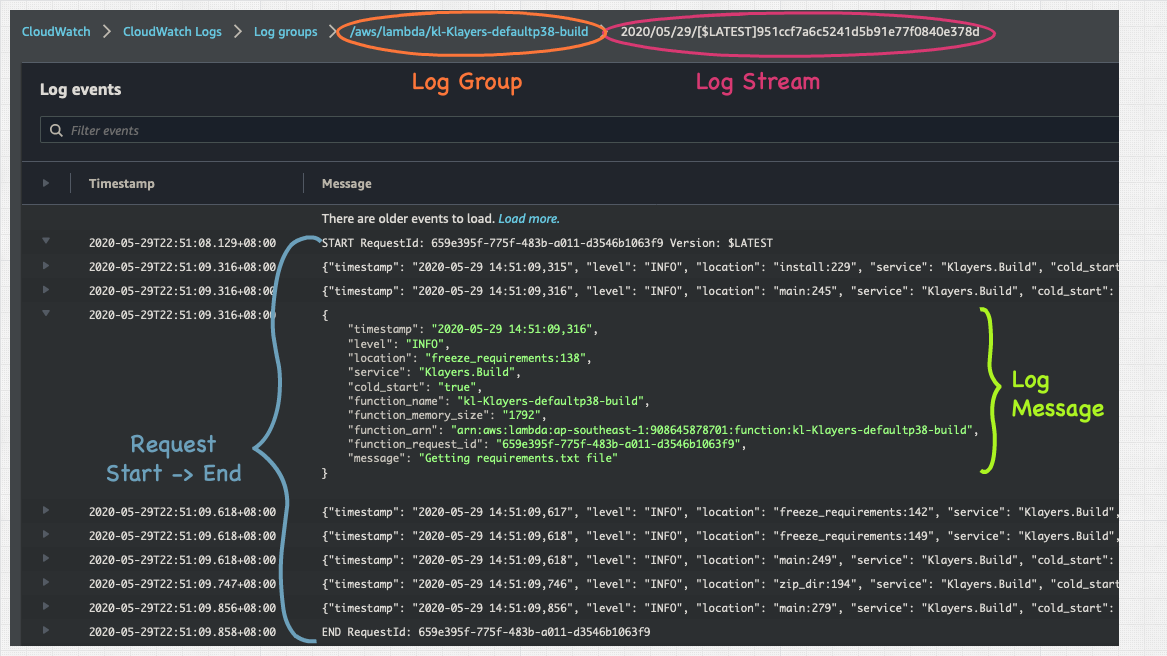
If you’re troubleshooting this one issue that occurred for that one customer back in May, drilling to the specific request is the place you want to quickly get into — as they are the actual events leading up to the issue in question. And in this post, we’ll delve into how to do that.
Side Note:
Choice of Framework is important. Serverless framework does this by default without the user even seeing it, but tools like Terraform require you to work through the verbosity of creating individual logGroups, and then assigning the right permissions,
logs:CreateLogStream, andlogs:PutLogEventsto the underlying functions. With Terraform modules this isn’t a monumental task, but it’s still undifferentiated heavy-lifting.
With that intro, let’s look at how we can configure our Logging within our Lambda Functions…
Logging in Python
To setup logging within a Lambda function use the following code snippet:
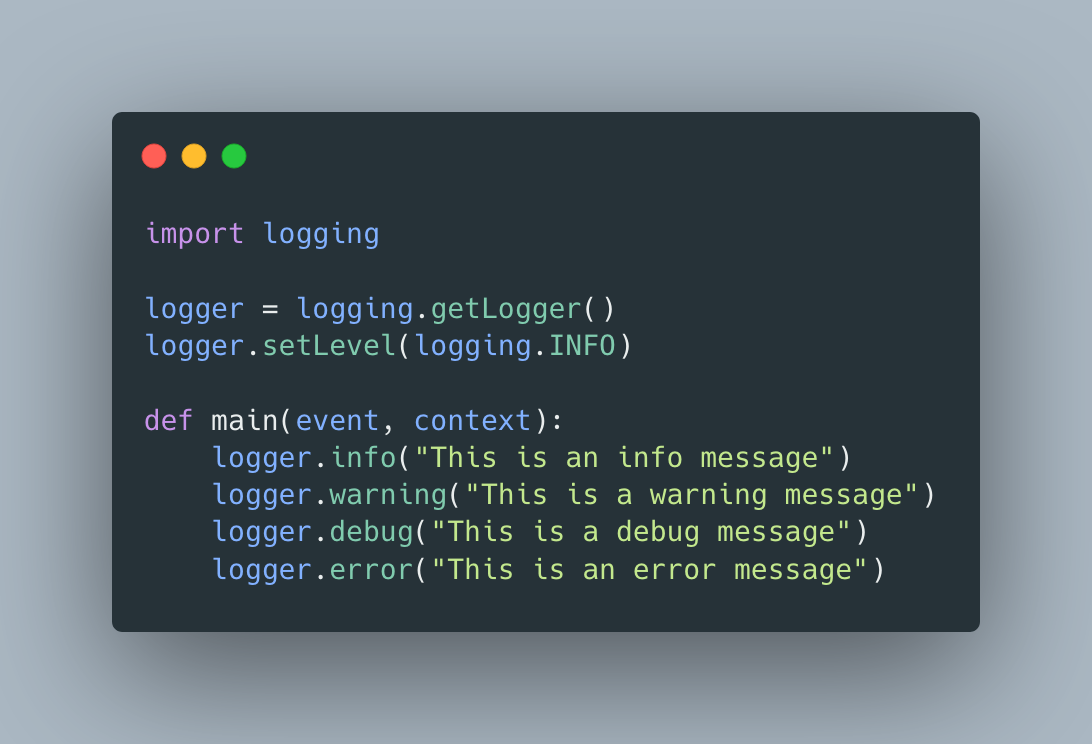
If you ran the code above in a Lamba Function, you’d get the following logs in cloudwatch (I removed some superfluous data)
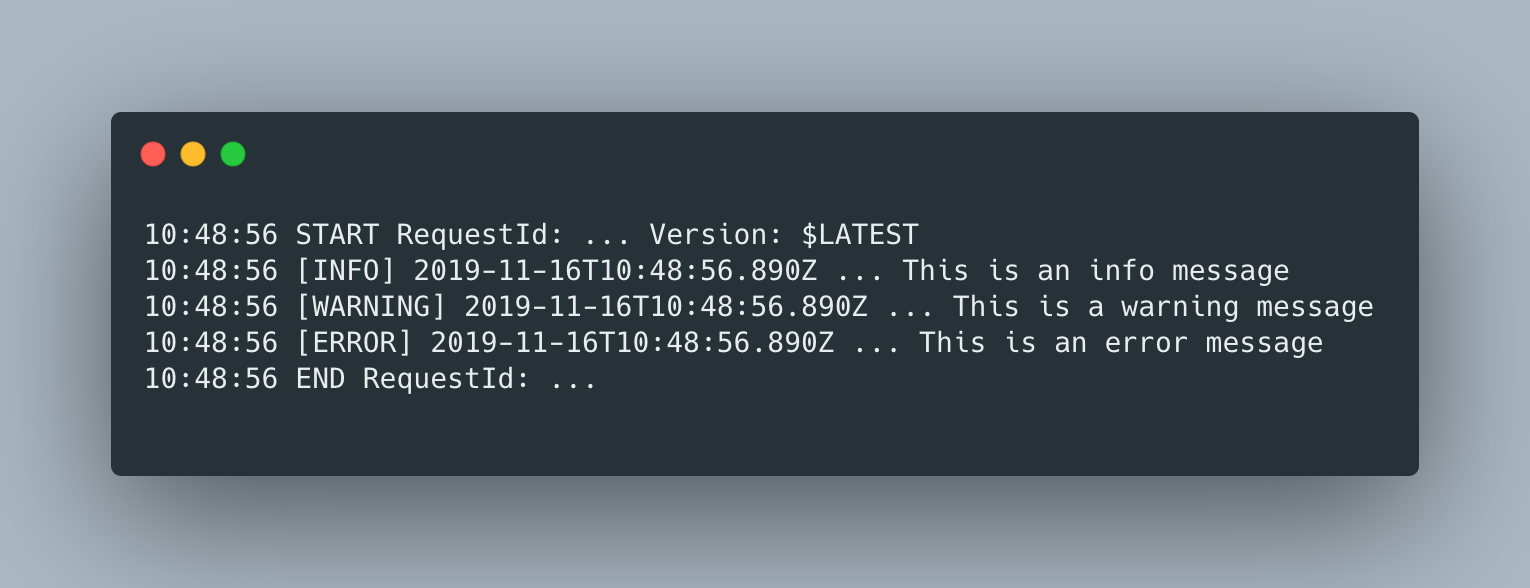
Obviously the Debug error wasn’t displayed, because the log setting is set to INFO, but the logs do still look verbose as they contain the standard log format, which is a tab delimited text made up of the following four fields.
- Level
- Time(isoformat) in milliseconds
- AWS_REQUEST_ID
- Log Message
But reading flat-lines of text aren’t ideal for analysis and consumption. Can you imagine parsing through 10,000 lines of this. Instead let’s try to change the format of the logs to something better like JSON, which will give us some sane structure.
AWS Lambda Powertools
To log out in JSON from within AWS Lambda simply use AWS Lambda Powertools. The tools allows us to add the ability to log out in structured JSON with just two lines of code (well 3 if you count the decorator):
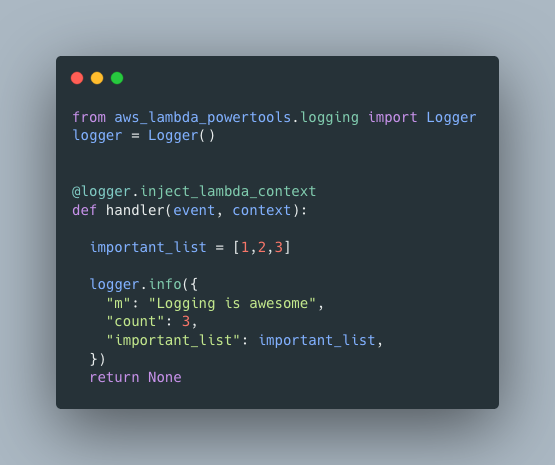
Once you’re logging out in JSON, half the battle is won. We’ve now got some structure that we can search within. We’ll soon see how to query these logs, but before that let’s explore the functionality power tools offers us.
Firstly, we can set log level via an Environment Variable, rather than within the function:
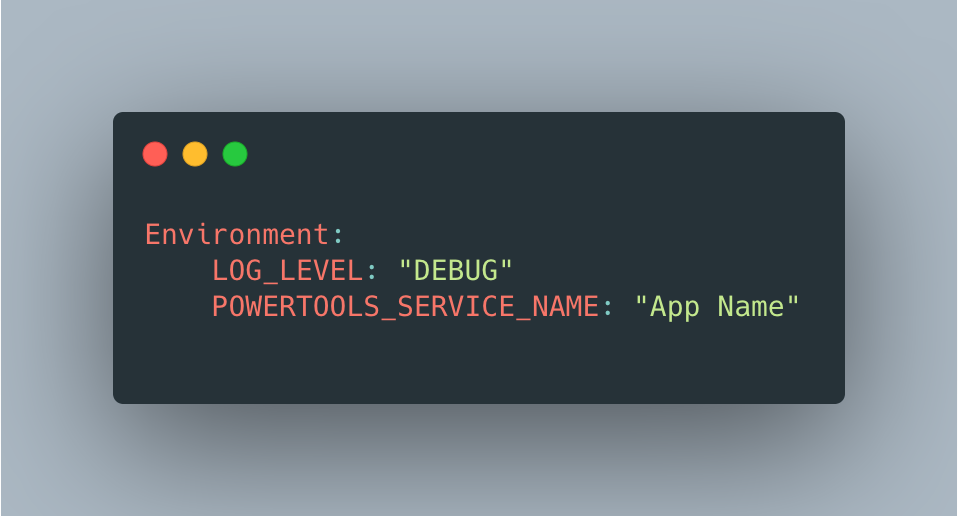
This allows to change the log level without redeploying functions. It only works though, if you’ve already pre-added these debug log lines throughout areas of your code.
You can dynamically set a percentage of your logs to DEBUG level via env var POWERTOOLS_LOGGER_SAMPLE_RATE. This will dynamically set a percentage of your requests to DEBUG, meaning any issues in production will already have a ready population of DEBUG logs to be consumed without any redeployment.
Fortunately, AWS Powertools is also available as a Lambda Layer from Klayers, so including it into your functions is as simple as pasting an ARN into the AWS Console.
But, as we said writing out logs is half the battle. Reading them is where we really see how powerful structured logging is.
Reading Logs
The benefit of structured logging boils down searching rather than reading.
By default, Cloudwatch can perform simple text based searching on logs from either LogStream or entire LogGroup, but when you structure your logs, you’re able to search individual fields within those logs with high granularity.
We can do this from within the AWS console or your tool of choice, but because the real magic is in the powerful filter and patterns available via default in Cloudwatch.
For example, querying for {$.level = "WARNING"} gives us all the WARNING messages in a log group, or {$.level = "WARNING" || $.level = "ERROR"} gives us both WARNING and ERROR messages.

But looking at a standalone error message isn’t helpful, we’d like to see the events leading up to the error. Fortunately, if you refer to screenshot above, each log message is also populated with a “function_request_id”, which corresponds to the request in question.
Now we’re in business.
Because if we search for just the request id, we can filter down to the specific lambda invocation that caused the error, and inspect the entire log messages from start to finish for just that single request. In this example we simply search for {$.function_request_id = "b959bd9a-edd4-4e02-94e5-15379a31479c"} :
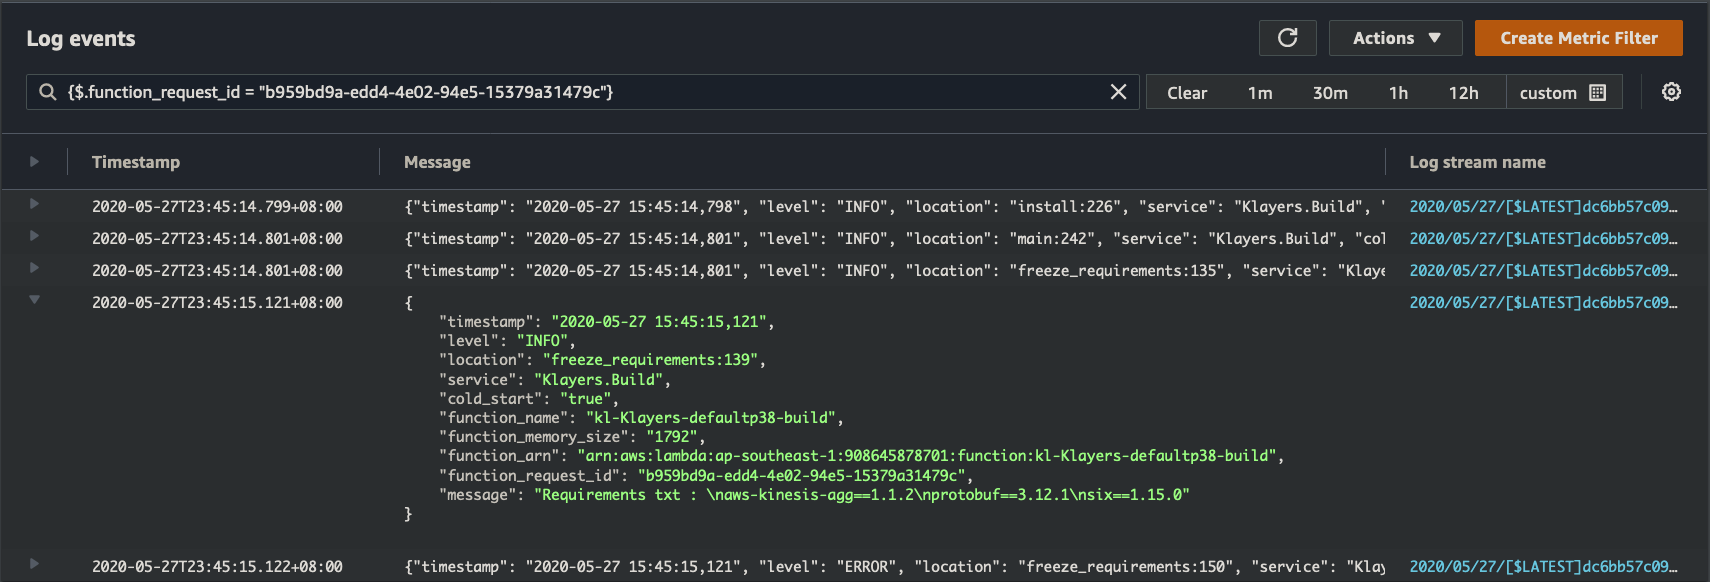
The major downside though, is if we have a uncaught exception, they tend to bypass the structured log output and print out non-JSON lines in the tab-delimited manner we saw earlier. However, we can still search for them by simply searching for "[ERROR]". From there, because we have a timestamp, and logStream, we can manually drill into the event. Less elegant, but still workable.

Before we move onto querying across multiple LogGroups, it’s always good practice to let the Lambda execution ‘die’, i.e. do not catch the exception and return, but allow the function to exit with an error code. This allows us to use tools like Lambda Destinations & Cloudwatch metrics to alert us on catastrophic issues, which would otherwise be hidden from view.
Another thing that’s easy to lose sight off, is that we don’t have a log server anywhere for this. Access to Cloudwatch logs can be controlled via IAM Roles (just like everything else on AWS), and we only pay for what is stored & searched in Cloudwatch. We can also set the log retention period to purge older logs out of the system so they stop costing money.
In other words, a highly scalable, minimal over-head solution, with no added servers or credentials to manage — which is pretty powerful straight outta of the box.
So far so good, but what if we wanted to query across multiple CloudWatch log groups? If we needed to triage an issue in an application, but didn’t know which function was causing it.
Cloudwatch Insights
Cloudwatch insights allows us to do similar search functionality, but across multiple Log Groups. Think of this as an application level log query tool.
By default, each cloudwatch log record will have a @message and @timestamp field. Modifying the format of the log output, changes the format of the @message field (it still exist). But if the format of the message is JSON, then cloudwatch automatically provides the ability to query on fields within @message by specifying just the field name.
For example, we can query all error logs from across multiple log groups using the following syntax
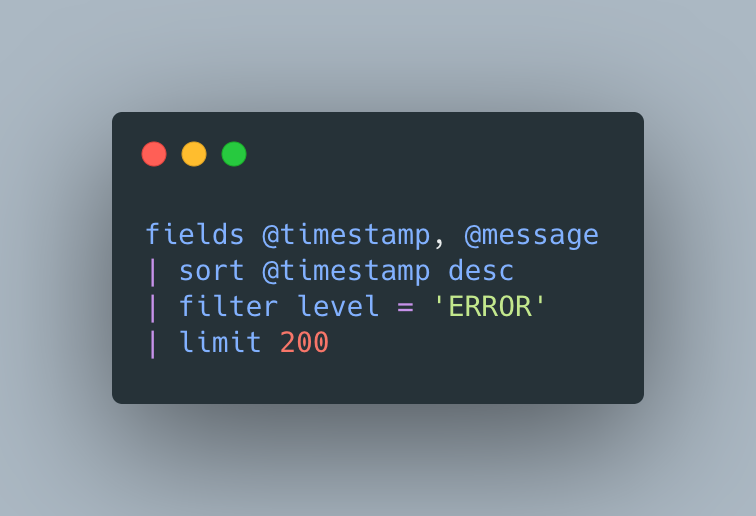
To the keen observer, this looks very similar to SQL Select queries, and indeed it is — but there’s still a small-ish learning curve. It’s not super quick or efficient, but it gets the job done, without servers or separate 3rd-party tools.
Coming soon
More mature logging would enable us to specify correlation ids, across multiple Lambda functions performing task for a specific user request or transaction. This allows us to log at a transactional level, instead of individual lambda request, which is probably Holy Grail territory for a lot of folks.
Unfortunately, I’m not smart enough to do this, but it’s something Powertools might look to do in the future!
Begrudgingly, this tooling exist for Javascript, which is still king when it comes to Lambda functions, but Python ain’t that far behind.
Conclusion
So to conclude on how to log within python functions in AWS Lambda:
- Use AWS Lambda Powertools to log out in structured format
- Be Judicious with your ‘INFO’ logging (and sensitive), but also ensure you have DEBUG logging ready-to-go if you need them
- Ensure the Logging Level (INFO, DEBUG) is not hard-coded into the function, but set as an environment variable which can be changed when you need to.
- Set the
POWERTOOLS_LOGGER_SAMPLE_RATEto ensure we have debug logs at some percentage. - Use Cloudwatch to query your logs, and cloudwatch insights for more wider search.
- Set the right retention period for your logs to reduce cost
- If you need more, consider 3rd-party tools which will include alerting/monitoring, but it’s always preferable to choose a SaaS solution than standing your own.
Proper logging might seem like a waste of time — but trust me, when it saves you hours of agonizing troubleshooting, you’ll never go back to not logging ever.
But what most developers do, is over-compensate by logging out everything — without any control, which makes analyzing logs a chore. The balance is ensuring we log out sufficient information (by setting the right log levels), and then having tools to comb through that info (using Cloudwatch insights) to us to quickly triage issues and gaining the most from our logs.
Once you get hang of it, a combination of cloudwatch logs, cloudwatch insights, and AWS Lambda Powertools, allows us to do effective and efficient logging within our functions, with minimal overhead in a completely serverless way.
Additional Reading
To learn more, the following references are useful:
- The python context object in Lambda
- Logging JSON in python
- Deep Dive into a Lambda
- AWS Lambda Powertools
- Filter Pattern Syntax for Cloudwatch
- Cloudwatch insights query
- AWS Lambda Powertools | Github
Final Credit
The wonderful @heitor_lessa has been working on Powertools, which itself was inspired by other tools from the community. While core serverless tools are rarely Open Source (since they’re tied to vendors), there’s still a lot of Open Source initiatives in and around serverless — and a wonderful community that’s growing alongside it as well.